📊 Observability with OpenTelemetry
Open WebUI (v0.4.0+) supports distributed tracing and metrics export via the OpenTelemetry (OTel) protocol (OTLP). This enables integration with monitoring systems like Grafana LGTM Stack, Jaeger, Tempo, and Prometheus to monitor request flows, database/Redis queries, response times, and more in real-time.
🚀 Quick Start with Docker Compose
The fastest way to get started with observability is using the pre-configured Docker Compose setup:
# Minimal setup: WebUI + Grafana LGTM all-in-one
docker compose -f docker-compose.otel.yaml up -d
The docker-compose.otel.yaml file starts the following services:
| Service | Port | Description |
|---|---|---|
| grafana/otel-lgtm | 3000 (UI), 4317 (OTLP gRPC), 4318 (OTLP HTTP) | Loki + Grafana + Tempo + Mimir all-in-one |
| open-webui | 8080 → 8080 | WebUI with OTEL environment variables configured |
After startup, visit http://localhost:3000 and log in with admin / admin to access the Grafana dashboard.
⚙️ Environment Variables
Configure OpenTelemetry using these environment variables:
| Variable | Default | Description |
|---|---|---|
ENABLE_OTEL | false | Set to true to enable trace export |
OTEL_EXPORTER_OTLP_ENDPOINT | http://localhost:4317 | OTLP gRPC/HTTP Collector URL |
OTEL_EXPORTER_OTLP_INSECURE | true | Disable TLS (for local testing) |
OTEL_SERVICE_NAME | open-webui | Service name tag in resource attributes |
OTEL_BASIC_AUTH_USERNAME / OTEL_BASIC_AUTH_PASSWORD | (empty) | Basic Auth credentials for Collector if required |
ENABLE_OTEL_METRICS | true | Enable FastAPI HTTP metrics export |
You can override these in your
.envfile ordocker-compose.*.yamlconfiguration.
📊 Data Collection
Distributed Tracing
The utils/telemetry/instrumentors.py module automatically instruments the following libraries:
- FastAPI (request routes) · SQLAlchemy · Redis · External calls via
requests/httpx/aiohttp - Span attributes include:
db.instance,db.statement,redis.argshttp.url,http.method,http.status_code- Error details:
error.message,error.kindwhen exceptions occur
Open WebUI creates worker threads only when needed, minimizing overhead while providing efficient trace export.
Metrics Collection
The utils/telemetry/metrics.py module exports the following metrics:
| Instrument | Type | Unit | Labels |
|---|---|---|---|
http.server.requests | Counter | 1 | http.method, http.route, http.status_code |
http.server.duration | Histogram | ms | Same as above |
Metrics are pushed to the Collector (OTLP) every 10 seconds and can be visualized in Prometheus → Grafana.
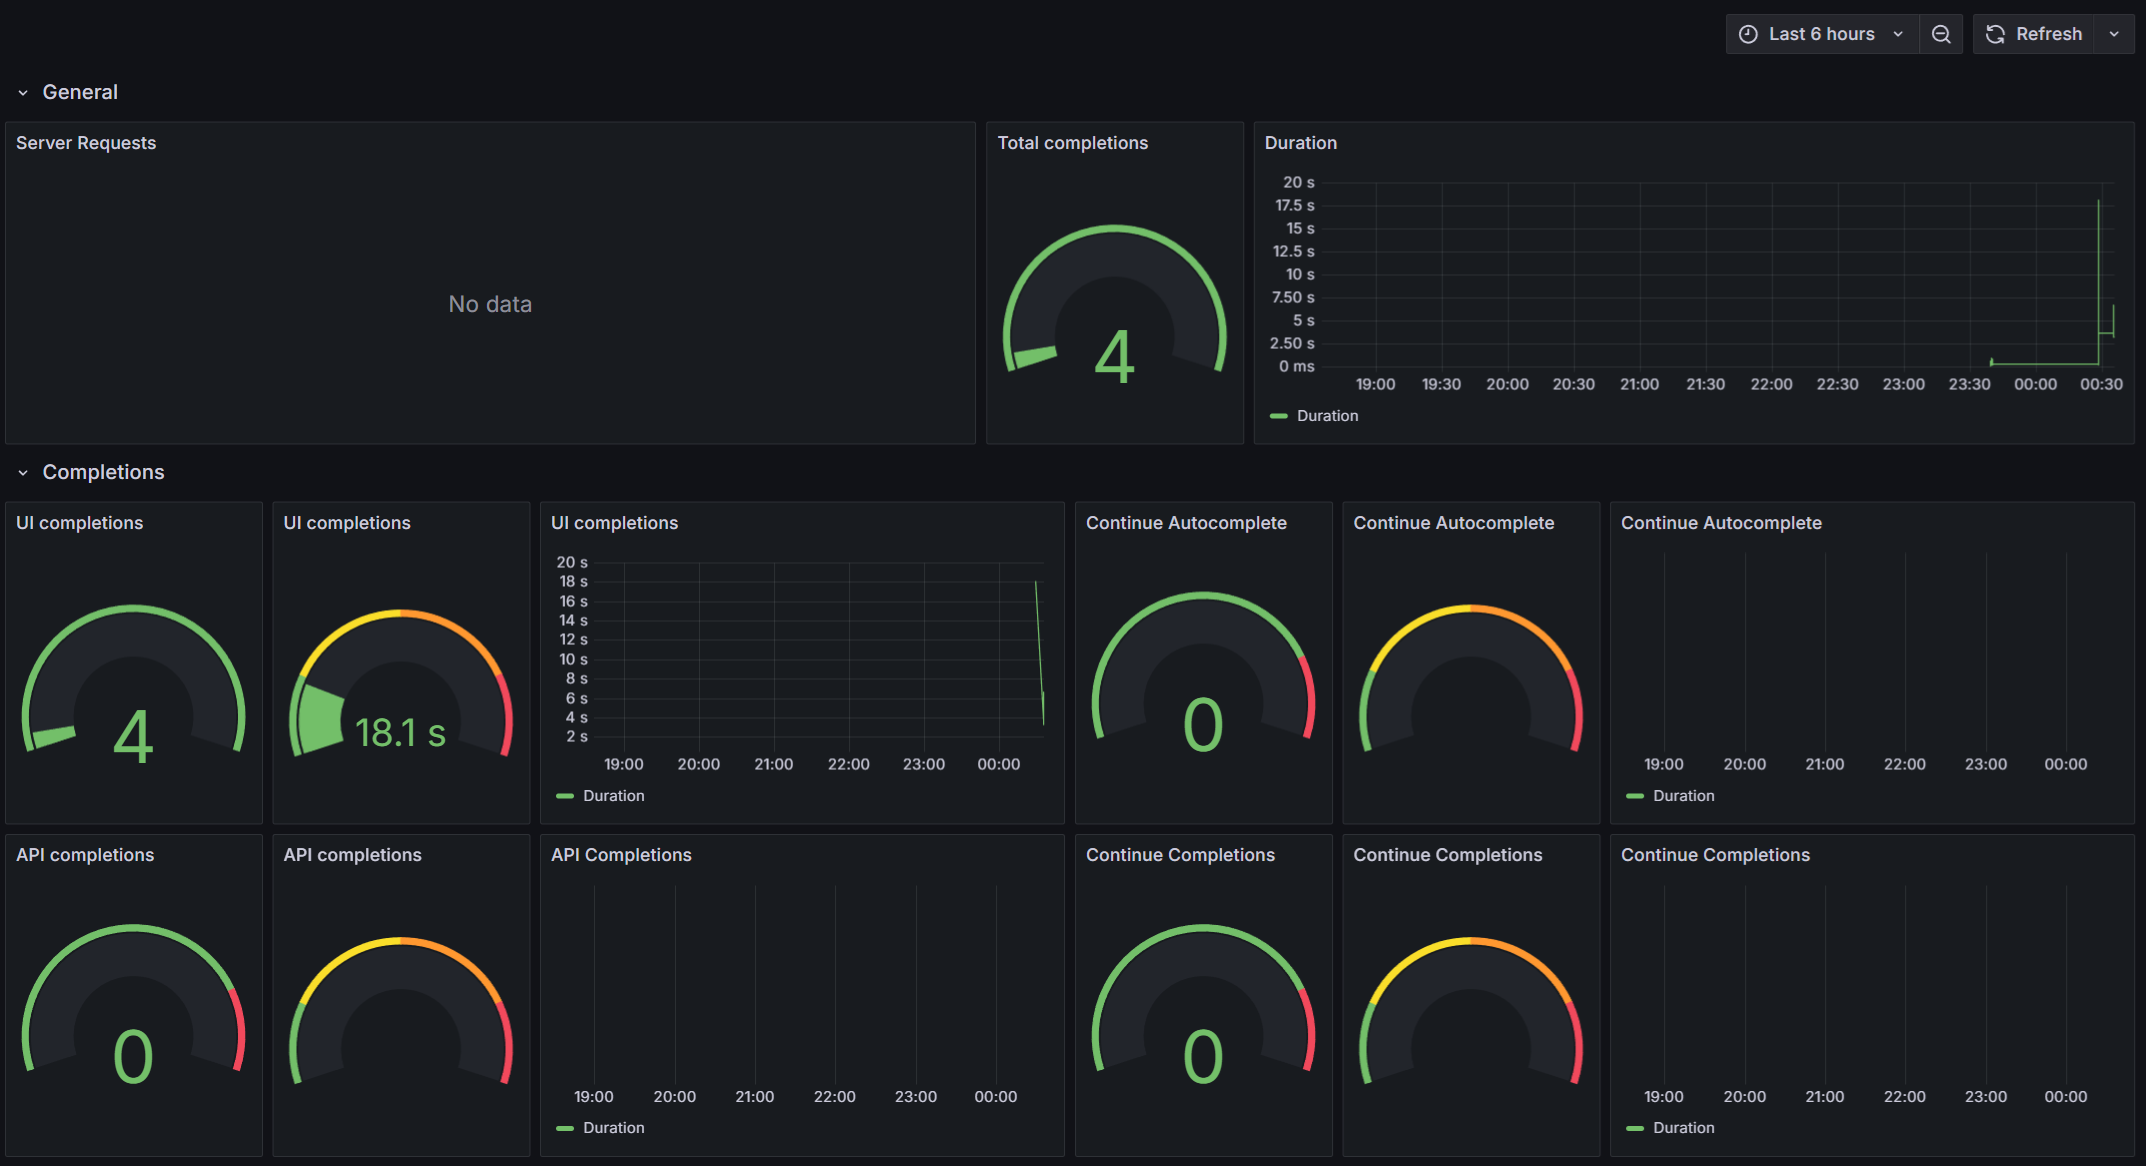
📈 Grafana Dashboard Setup
The example LGTM image has pre-configured data source UIDs: tempo, prometheus, and loki.
Importing Dashboard Configuration
- Dashboards → Import → Upload JSON
- Paste the provided JSON configuration (
docs/dashboards/ollama.json) → Import - An "Ollama" dashboard will be created in the
Open WebUIfolder
For persistent dashboard provisioning, mount the provisioning directories:
grafana:
  volumes:
    - ./grafana/dashboards:/etc/grafana/dashboards:ro
    - ./grafana/provisioning/dashboards:/etc/grafana/provisioning/dashboards:ro
Exploring Metrics with Prometheus
You can explore and query metrics directly using Grafana's Explore feature:
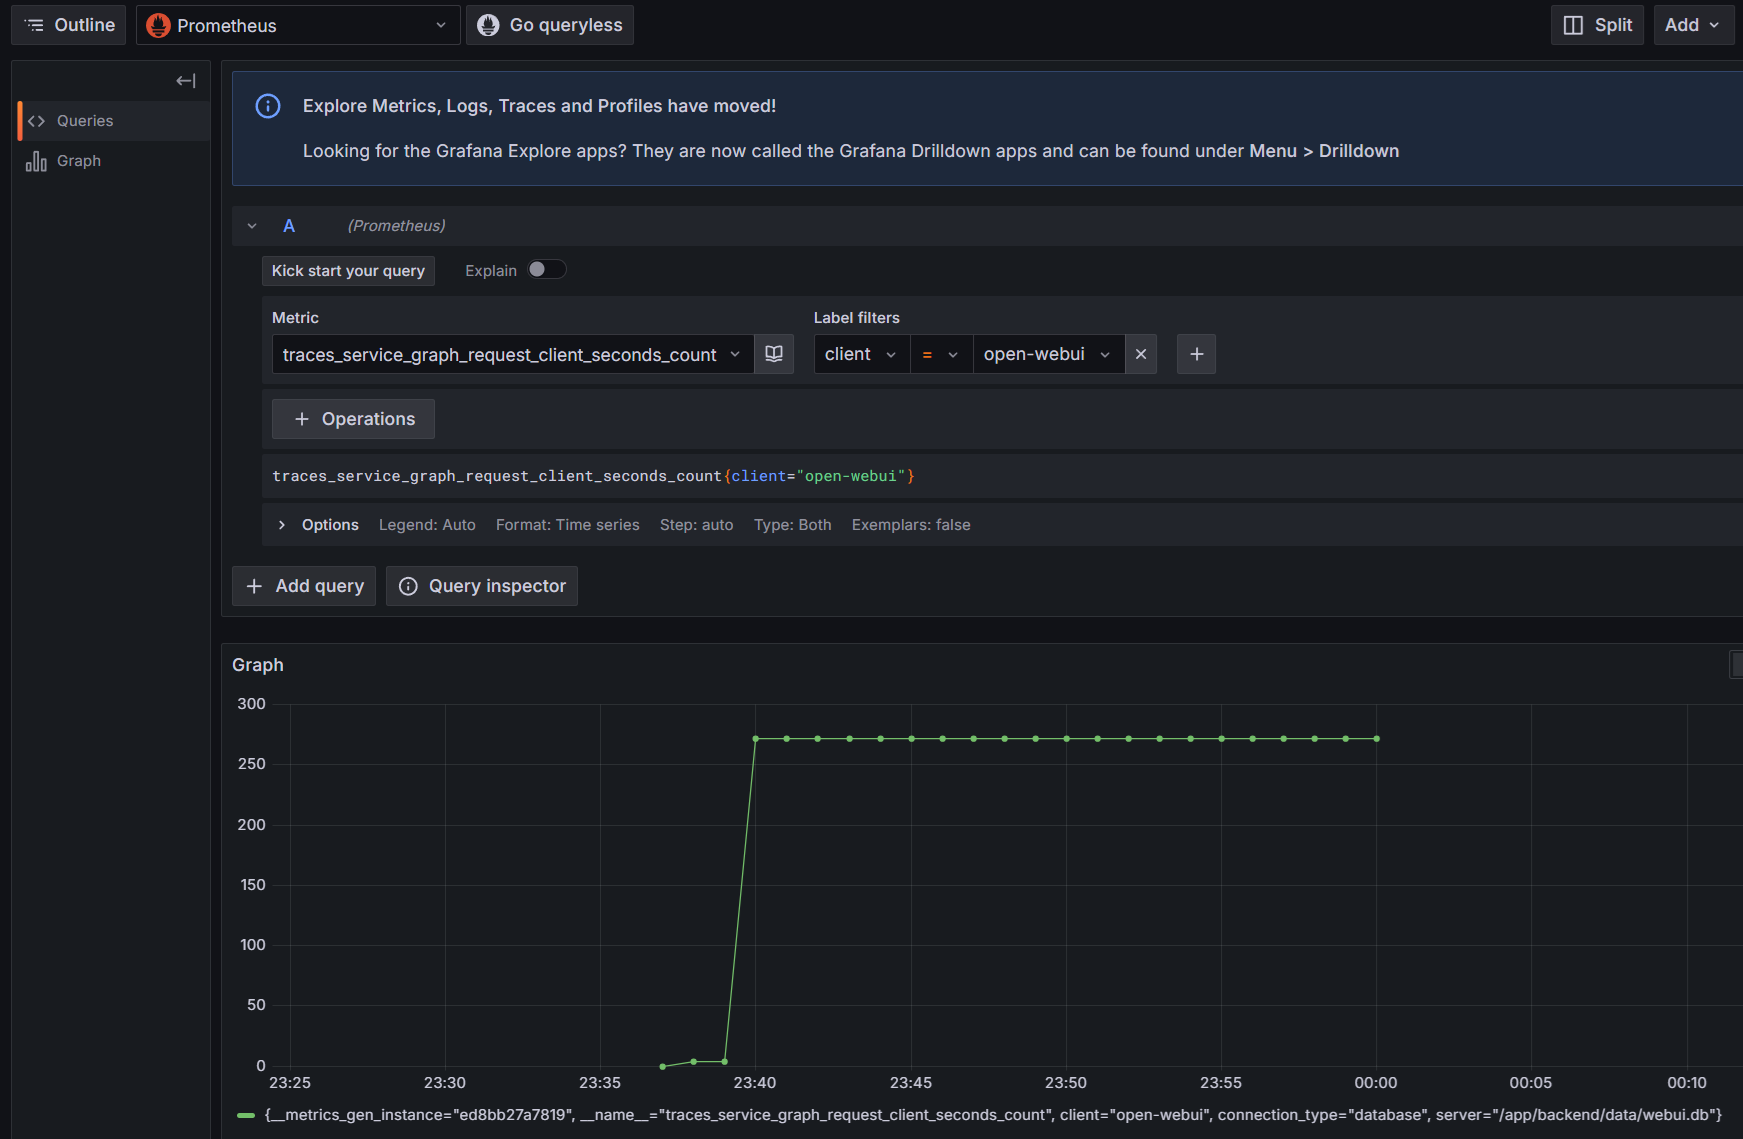
This allows you to:
- Run custom PromQL queries to analyze API call patterns
- Monitor request rates, error rates, and response times
- Create custom visualizations for specific metrics
🔧 Custom Collector Setup
If you're running your own OpenTelemetry Collector instead of the provided docker-compose.otel.yaml:
# Set your collector endpoint
export OTEL_EXPORTER_OTLP_ENDPOINT=http://your-collector:4317
export ENABLE_OTEL=true

# Start Open WebUI
docker run -d --name open-webui \
  -p 8080:8080 \
  -e ENABLE_OTEL=true \
  -e OTEL_EXPORTER_OTLP_ENDPOINT=http://your-collector:4317 \
  -v open-webui:/app/backend/data \
  ghcr.io/open-webui/open-webui:main
🚨 Troubleshooting
Common Issues
Traces not appearing in Grafana:
- Verify
ENABLE_OTEL=trueis set - Check collector connectivity:
curl http://localhost:4317 - Review Open WebUI logs for OTLP export errors
High overhead:
- Reduce sampling rate using
OTEL_TRACES_SAMPLER_ARG - Disable metrics with
ENABLE_OTEL_METRICS=falseif not needed
Authentication issues:
- Set
OTEL_BASIC_AUTH_USERNAMEandOTEL_BASIC_AUTH_PASSWORDfor authenticated collectors - Verify TLS settings with
OTEL_EXPORTER_OTLP_INSECURE
🌟 Best Practices
- Start Simple: Use the provided
docker-compose.otel.yamlfor initial setup - Monitor Resource Usage: Track CPU and memory impact of telemetry
- Adjust Sampling: Reduce sampling in high-traffic production environments
- Custom Dashboards: Create application-specific dashboards for your use cases
- Alert Setup: Configure alerts for error rates and response time thresholds